|
Brent Harris Elliott Wave
Futures Market
Advisory Service
Quarterly Report Sample Page
Dow Jones Industrials (Oct. 10,
2005)
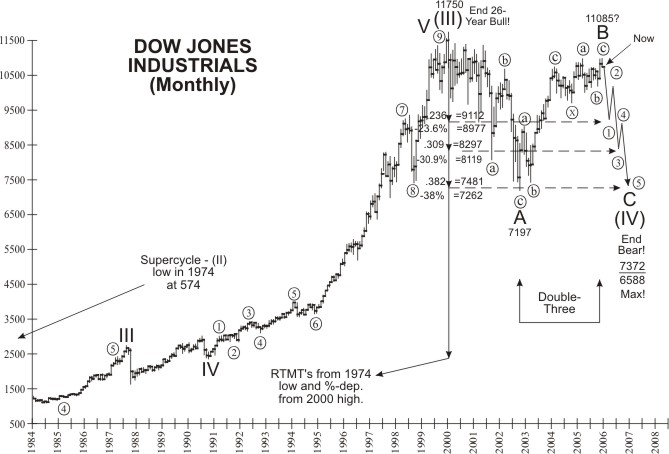
While the intermediate-term pattern in the
Dow Jones Industrial Average (DJIA) does allow for a FINAL penetration of the
March 2005 peak (+10987), BOTH my long-range “pattern” and “time” analysis
strongly indicate that a major DECLINE will be underway by no later than January
2006. In essence, because the SUPERCYCLE-WAVE-(IV) decline from the January 2000
peak should be similar in magnitude AND duration to that of the
1996-1974/wave-(11) decline, the “orthodox” low ought to occur by about January
2008; at approximately the 7372-6588 level. This would represent an EQUAL,
8-year duration AND a decline of an EQUAL 38.2%-to-44.1%-depreciation. So,
considering that the initial, A-wave decline lasted for 2 3/4-years, it stands
to reason that the FINAL, C-wave section down will also consume a 2-to-2
3/4-year time-frame. In fact, IF the CYCLE-WAVE-B advance has already peaked; at
the March 2005 high, a decline into the December 2007/January 2008 time-frame
would produce an EXACT, 2.75-year/C-wave. To that end, given that S&P 500 has
just recently exceeded the key 9.1%-retracement/support projection from the 2002
low, AND depreciations of 3.441% and 23.6%-from the 2005 and 2000 highs,
respectively, or 1205.50-to-1202.50, I think traders have to play the
short-side...now. If wave-B has indeed peaked, then it is likely that the S&P
500 will now hold BELOW interim resistance; at 1218.30-1219.20. The next lower
areas of support for the S&P 500 are now at 1179.40-1178.70, 1158.00-1157.00,
1136.40-1135.30, 1117.70, 1101.60-1100.10, 1087.65-1082.60, 1066.80-1065.00
(*best), and 1038.70-1030.20.
ORDER BRENT'S QUARTERLY REPORT |